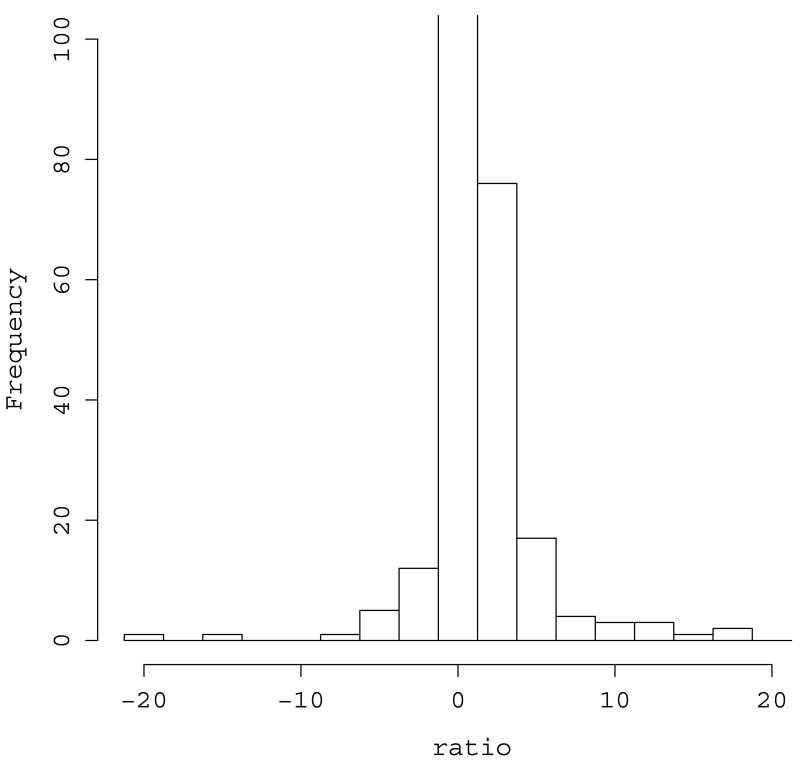
Fig. 3.
Co-occurrence of ROH regions in cases and controls: Distribution of Aij/Aji normalized ratio where Aij is the count of number of i controls and j cases for which a SNP was in an ROH region. A continuity correction was used and we obtained 1−[(Aij/Aji)/(171/121)] where 171/121 is the ratio of the number of cases to the number of controls. For values < 0, we used the inverted value, i.e., − Aji/Aij. Cells in which there were 0 cases and 0 controls received 0 as their normalized value. The y-axis is truncated at 100.

