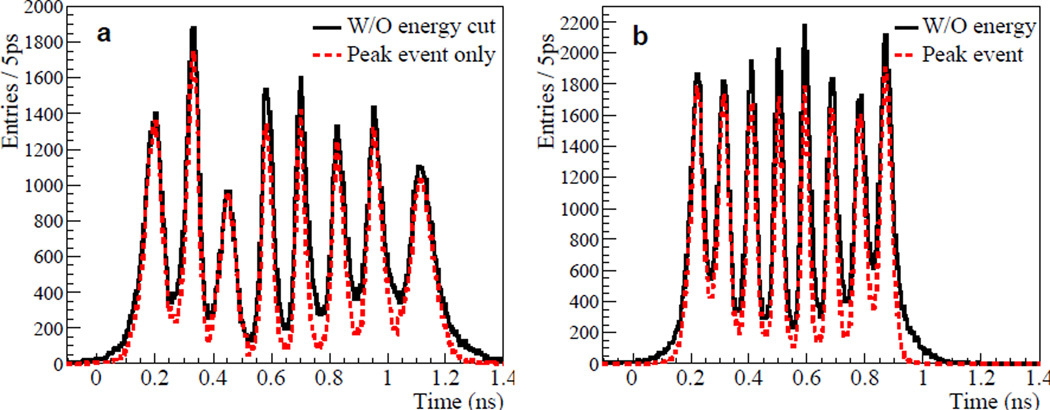
Figure 9.
dT histograms on strip-line measured for SLB#1 (a) and SLB#2 (b). The histograms using only 511 keV photo-peak events are plotted in dashed lines, and large entry reduction at the valleys is manifested in the histograms with the photo-peak events only. The DRS4 sampling rate is set to 5.0 GS/s.

