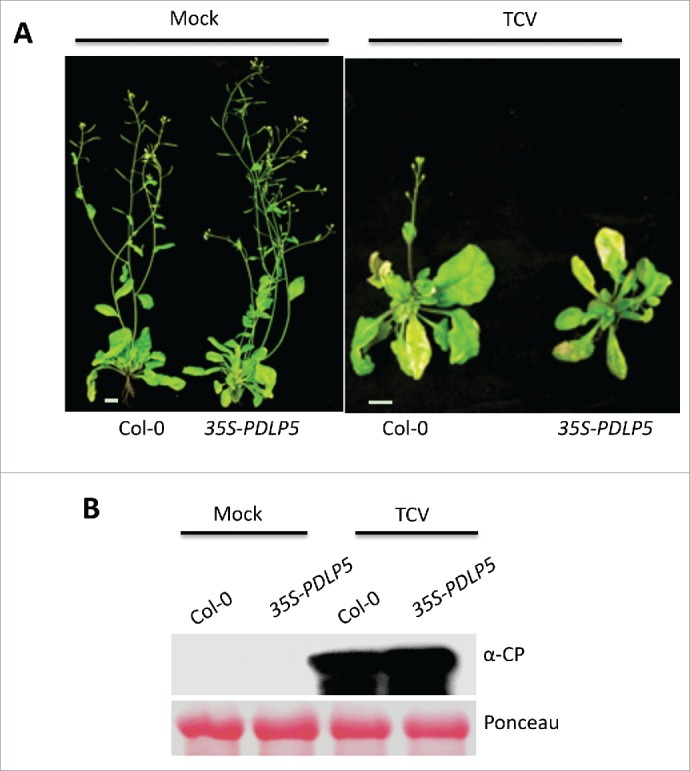
Figure 2.

Spread and replication of TCV to uninoculated leaves. (A) Typical morphological phenotypes shown by mock- (left panel) and TCV (right panel)-inoculated plants at 17 dpi (scale bars, 0.5 cm). (B) Protein gel blot analysis showing levels of TCV in the bolt tissues of Col-0 and 35S-PDLP5 plants at 3 d post inoculation. Approximately 50 µg of total protein was fractionated on a SDS-PAGE and subjected to immunoblot analysis using anti-CP antibodies. Levels of Rubisco were used as loading control.
