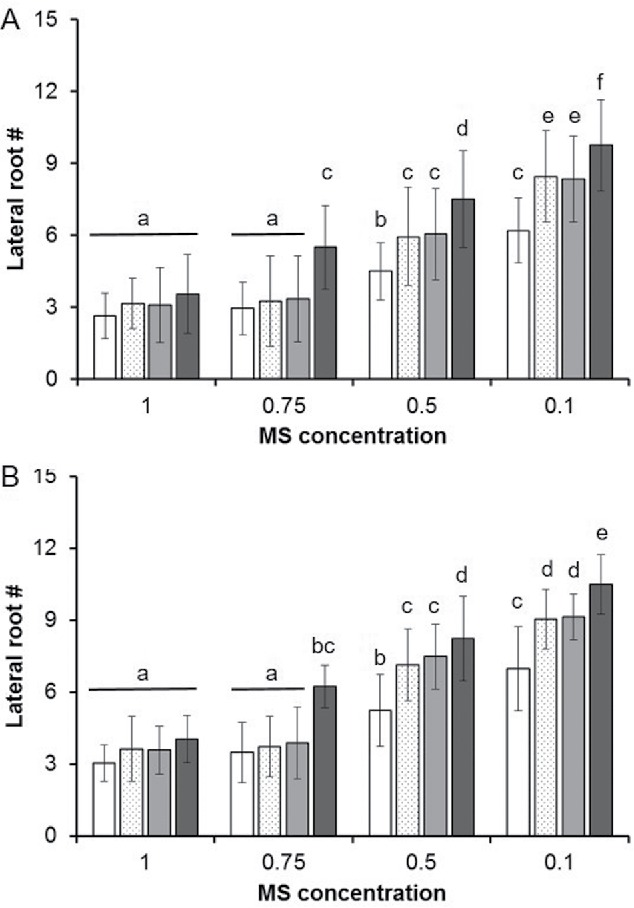
Figure 2.

Inducing CR and ER in Arabidopsis thaliana. Seedlings of the A. thaliana (A) Col-0 and (B) LA-1 accessions were grown on plates of the indicated concentration of MS. Lateral root number for all samples (n = 50) were scored after 18 d of growth (See Methods). White Bars: SOLO (individual seedlings), Matted dots: SIBLINGS (2 seedlings from the same seed pod), Light Gray Bars: Accession-resolution (ER, 2 seedlings of the same accession), and Dark gray: Conspecific-resolution (CR, 2 seedlings of different accessions). Results are expressed as the mean of the lateral root number +/− standard deviation. Different letters indicate statistically significant differences samples based on Tukey's post-hoc test (p-value < 0.05).
