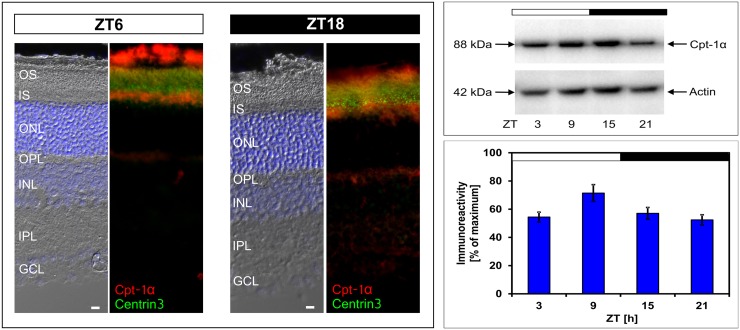
Fig 2. Localization and 24-h profiling of Cpt-1α protein in retina.
Left column: Micrographs of coronal sections of the retina, labelled for Cpt-1α (red) and Centrin3 (green) at Zeitgeber times (ZT) 6 and 18. The representative immunofluorescent images show that Cpt-1α protein is primarily located in the inner segments of PRCs with no difference in the localization between ZT6 and ZT18. The upper right column shows a representative Western blot with Cpt-1α immunostaining at about 88 kDa and β-Actin staining as a loading control. The diagram on the lower right column displays the quantification of Cpt-1α immunoreactivity in relation to the corresponding β-actin signal to which it was normalized. Data were obtained using densitometric measurement and represent percentages of the overall maximal value. Each value represents mean ± SEM (n = 8; each n represents one animal / two retinae). The solid bars indicate the dark period. Note that Cpt-1α immunoreactivity exhibits daily changes with peak expression around ZT9 (*p < 0.05 in one-way ANOVA). OS, outer segment; IS, inner segment; ONL, outer nuclear layer; OPL, outer plexiform layer; INL, inner nuclear layer; IPL, inner plexiform layer; GCL, ganglion cell layer. Scale bar, 10 μm.

