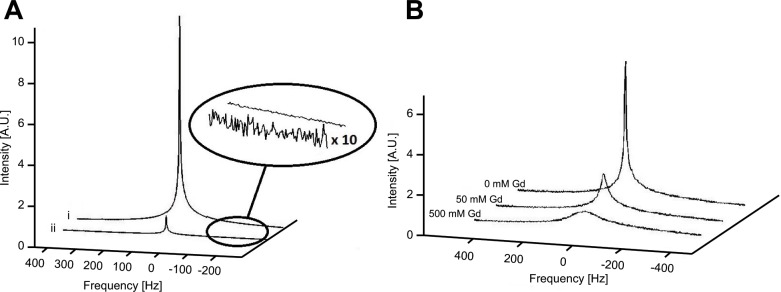
Fig 2. 19F spectra with varying fluorine concentration and paramagnetic broadening.
(A) Spectra of 1000 mM (i) and 100 mM (ii) concentrations of C3. The magnified section shows the scaled noise section. (B) Spectra of C3 (900 mM) with varying concentrations of gadolinium added. The origin of the spectra (0 Hz) in both (A) and (B) corresponds to a laboratory frame of reference on-resonance with the main signal.

