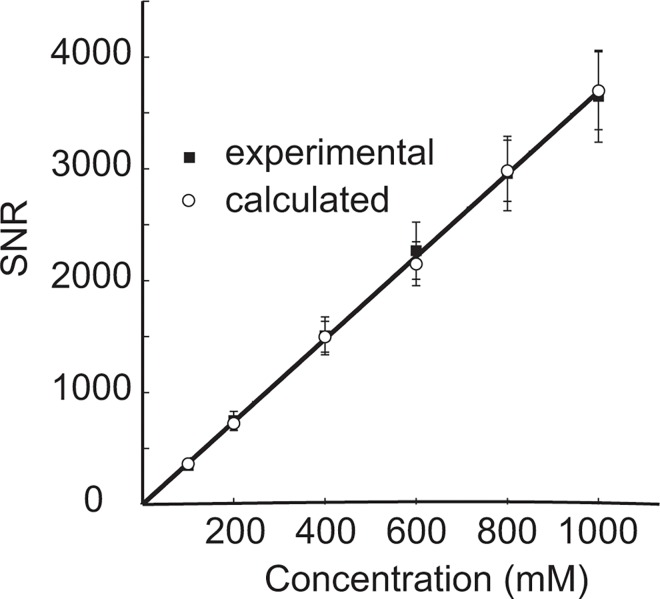
Fig 4. Minimum detectable concentrations in fluorine MRS.
Experimental (solid squares) and calculated SNRs (open circles) vs. concentration for compound C3. The calculated SNR was obtained from an average calibration factor using Eq 7. Lines of best fit were extrapolated to determine a minimum detectable concentration assuming a minimum required SNR of 3.5. The fitting of the experimental and derived data resulted in a minimum detectable limit of 0.947 mM and 0.948 mM respectively.

