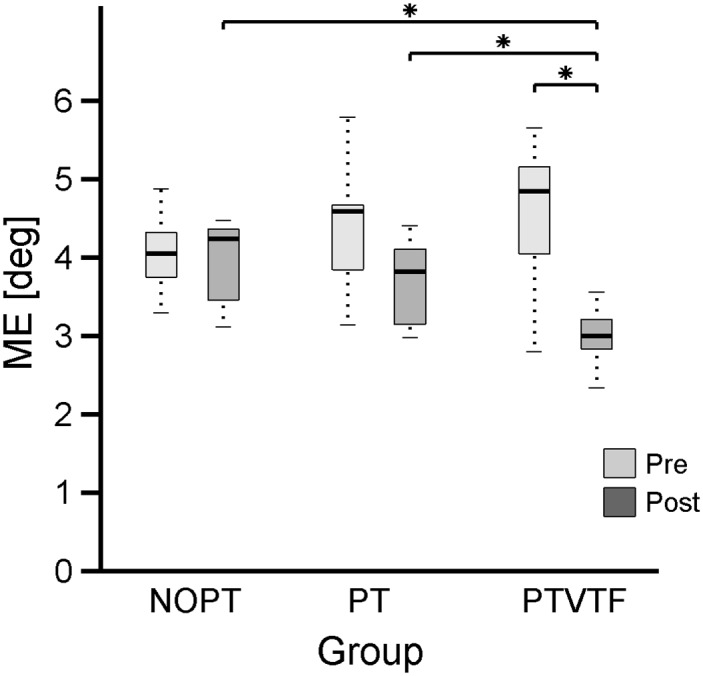
Fig 3. Effect of proprioceptive training on proprioceptive acuity.

The boxplot shows the pre- and post-training distribution of the position matching error (ME) for each experimental group. Medians are indicated by the solid line inside the box. The lower and upper edges of the box represent the 25th and 75th percentiles, respectively. The whiskers indicate the 1st and 99th percentile. Asterisks (*) indicate statistically significant differences for between-group (POST: PT vs PTVTF; NOPT vs PTVTF) and within-group (PTVTF: PRE vs POST) comparisons.
