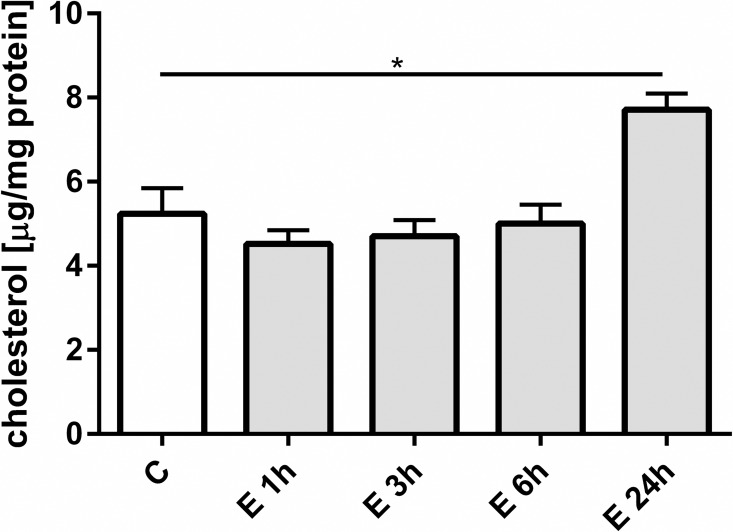
Fig 2. The change of total intracellular intracellular cholesterol content in HUVEC following treatment with 3 μM β-escin.
Abbreviations: C—untreated HUVEC; E—β-escin treated cells. The results are expressed as the mean ±SEM of three independent experiments with cells obtained from at least six donors. Data were analyzed by one-way analyses of variance (ANOVA) followed by the post hoc Tukey multiple range test. *p < 0.05

