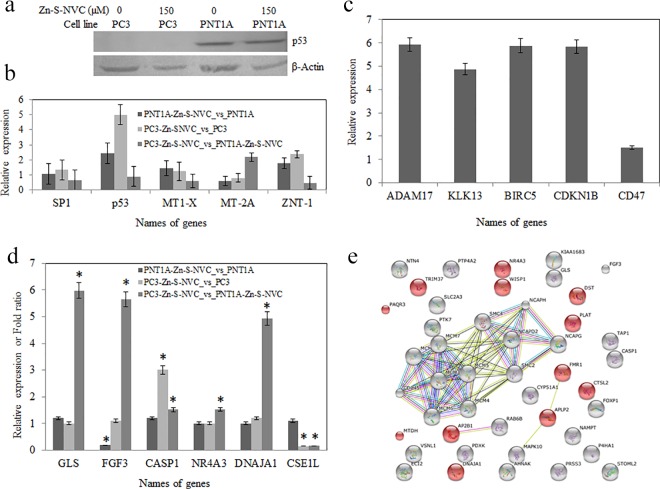
Fig 5. Gene expression analysis.
A) Western blot analysis of p53 protein expression revealed no expression in PC3 cells and no change in PNT1A cells. Western blot analysis using anti-p53 (sc-126) after treatment with 150 μM Zn-S-NVC complex for 40 min. Anti-β-Actin (sc-130657) was used as an internal control. B) Change in the gene expression in PC3 and PNT1A cells assessed by qRT-PCR. Relative expression or fold change in genes after treatment with 150 μM Zn-S-NVC complex for 40 min. The qRT-PCR data were normalized to the internal control 18S rRNA. The mean change is shown for two independent experiments (bars represent the standard deviation). C) Up-regulated genes in PC3 cells before treatment with Zn-S-NVC complex by microarray (PC3_vs_PNT1). D) Relative expression or fold change in genes in response to different treatments after application of Zn-S-NVC complex in PC3 and PNT1A cells by ElectraSense CombiMatrix microarray (bars represent the error standard, * indicates significant differences between treatments). E) Globally up-regulated genes in PC3 and PNT1A cells after treatment with Zn-S-NVC complex assessed using KEGG 10 software (Known and Predicted Protein-Protein Interactions). The red-colored genes indicate genes that negatively regulate cellular processes (metabolic, cell death or apoptotic processes). Different line colors represent the types of evidence for the association (neighborhood, gene fusion, co-occurrence and co-expression).

