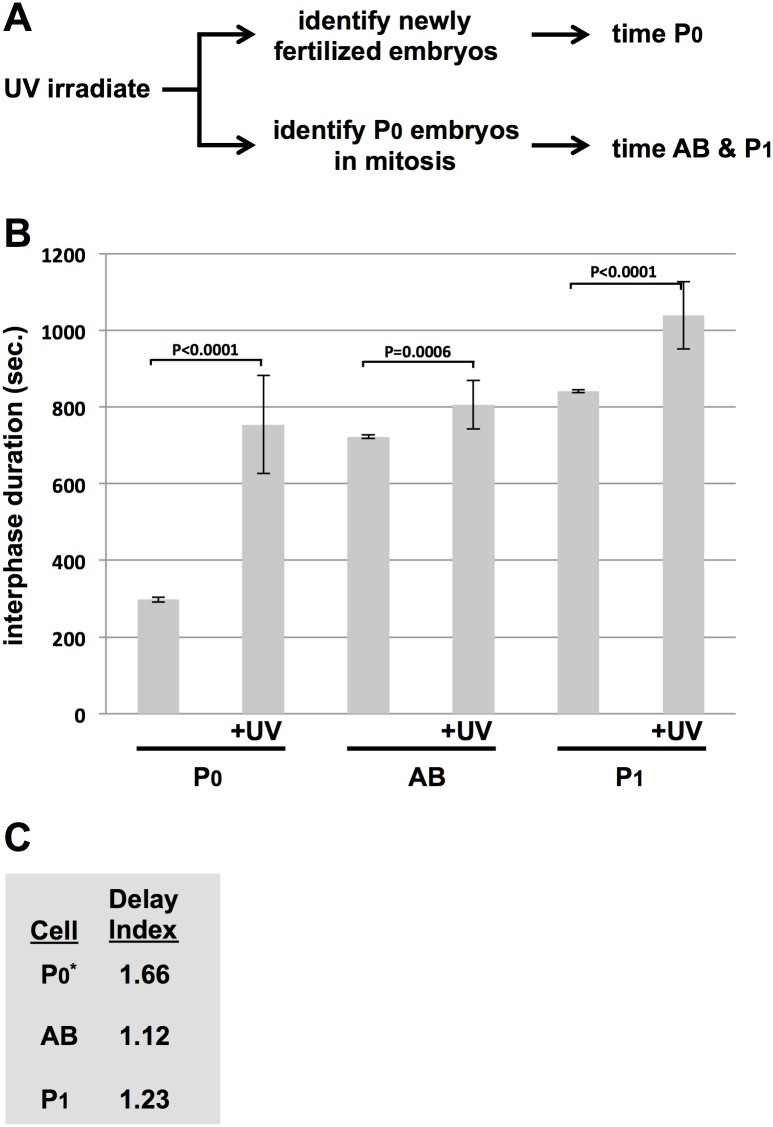
Fig 7. Comparing the UV-C response between the P0, AB, and P1 blastomeres.
(A) Schematic depicting the experimental strategy, whereby UV-C induced replication stress is applied just prior to the S-phase of interest. (B) N2 animals were optionally treated with UV-C and interphase duration for a given cell type was plotted. Each data point represents the average of 10 embryos obtained over two biological replicates (5/replicate). (C) The Delay Indices (DI) for the given cell types are depicted.

