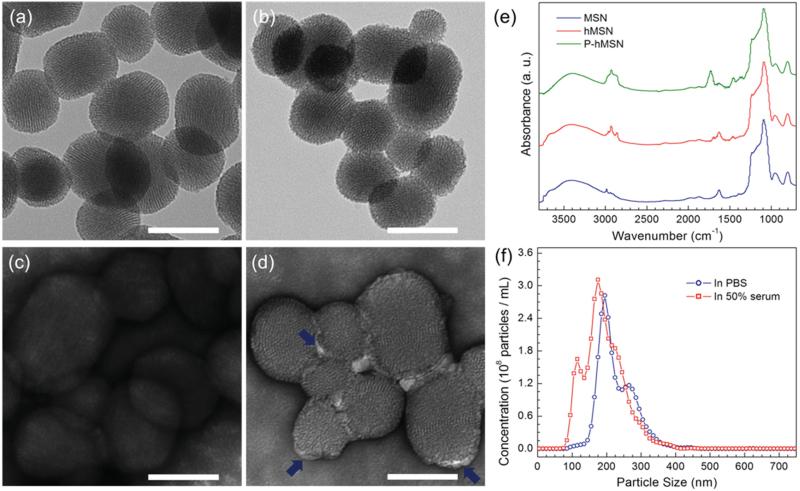
Figure 2.
Characterization of the mesoporous silica nanoparticles. a–d) TEM images of MSN and P-hMSN. Bare MSN without a) and with c) uranyl acetate stain. P-hMSN without b) and with d) uranyl acetate stain. Blue arrows in d) indicate the stained F127 layer around the particles. e) FTIR spectra of MSN, hMSN, and P-hMSN. f) Size distribution of P-hMSN in PBS and 50% fetal bovine serum as determined by Nanoparticle Tracking Analysis. All scale bars are 100 nm.

