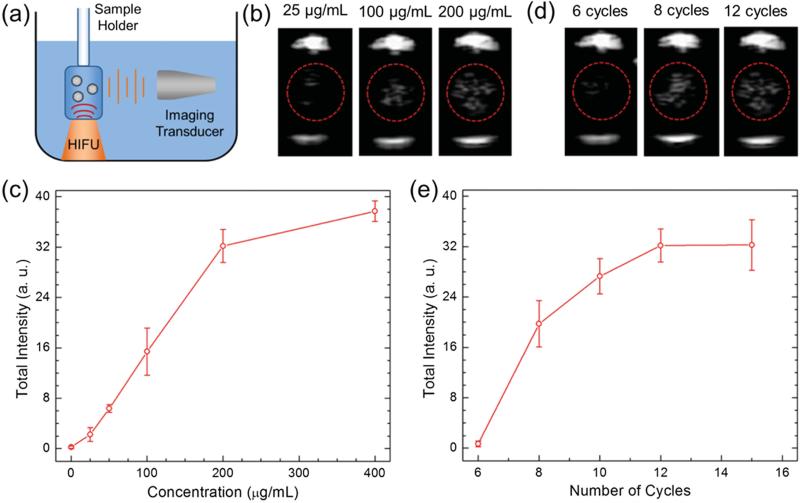
Figure 3.
a) Schematic of the ultrasound signal measurement setup from the HIFU exposed nanoparticles. b) Representative images were taken from movies acquired during HIFU irradiation of nanoparticles at different concentrations. c) Calculated total intensities from the acquired movies of P-hMSN samples with different concentrations exposed with 12 HIFU cycles. d) Representative images were taken from movies acquired during HIFU irradiation at different number of cycles. e) Calculated total intensities from the acquired movies of P-hMSN samples (200 μg mL−1) were exposed with different HIFU cycles. Error bars = 1 SD, studies were run in triplicate.

