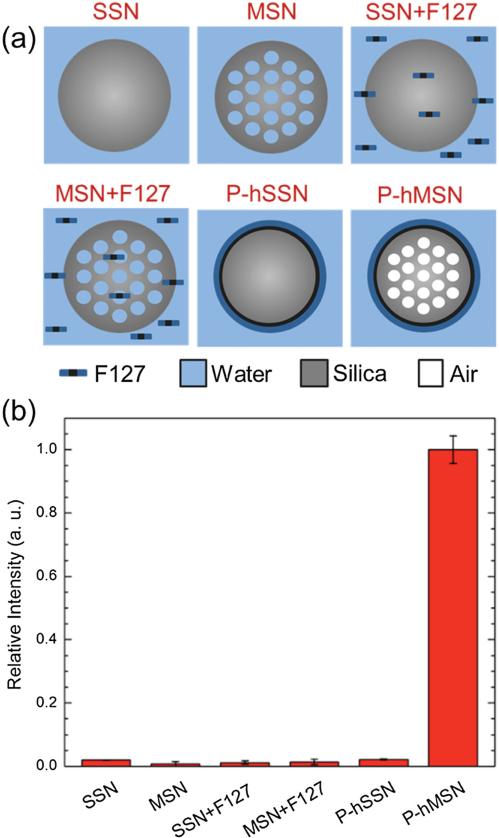
Figure 4.
a) Schematic representation of the particles and conditions were used in the control experiments. b) Total intensities (relative to response of P-hMSN) were calculated from the acquired movies for control conditions; for all particles concentration was 400 μg mL−1, F127 concentration in SSN+F127 and MSN+F127 samples was 1 mg mL−1. Error bars = 1 SD, studies were run in triplicate.

