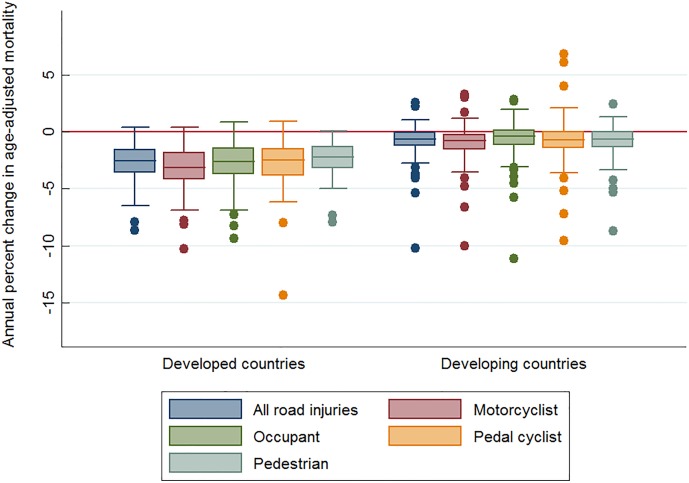
Fig 1. Annual percent change in age-adjusted mortality per 100,000 population in 2010–2013 by type of road user and country.
Notes: 1. Annual percent change in age-adjusted mortality was estimated based on negative binomial regression. 2. Mortality data from Global Burden of Disease 2013. (http://www.healthdata.org/gbd/data-visualizations).

