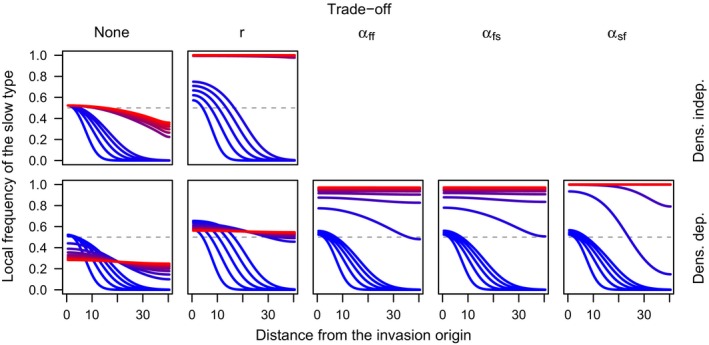
Figure 1.

Spatial spread of the slow type under different scenarios about density dependence and life‐history trade‐offs under the clonal model in equations (2a) and (2b). Each curve shows the invasion profile of the slow type at a given point in time, with time indicated by colors ranging from blue at time τ = 0 to red at time τ = 100 in the top row and τ = 400 in the bottom row.
