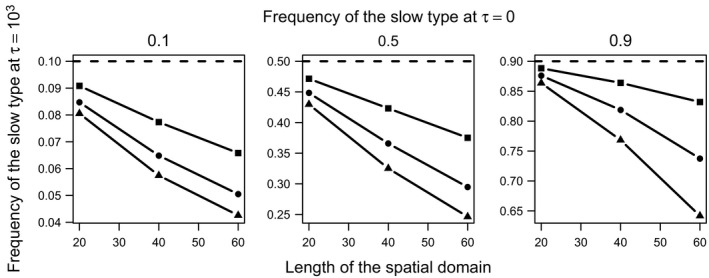
Figure 3.

Frequency of the slow type across the entire spatial domain long after all locations have been invaded and equilibrium densities at each location have been attained (i.e., τ = 103). These frequencies, which correspond to the frequency indicated by the red line in the bottom left panel of Figure 2, are shown here as a function of the length of the spatial domain (x‐axis), the initial frequency of the slow type (dashed lines, separate panels), and the relative dispersal ability of the fast type (square: D = 1.1, circle: D = 1.2, triangle: D = 1.3).
