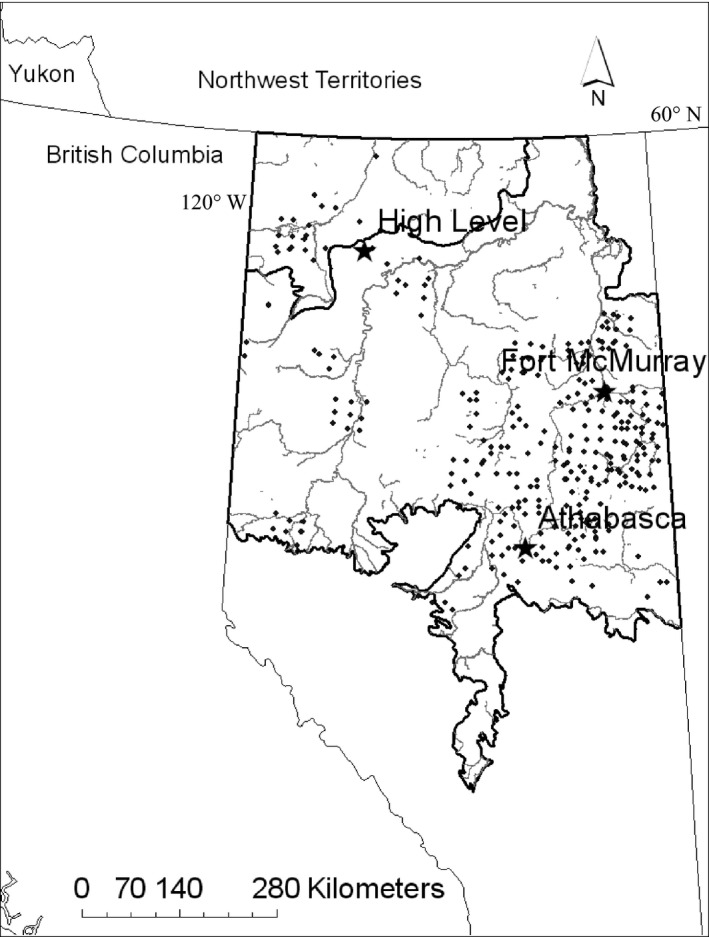
Figure 1.

Study area. Dark black outline indicates the two ecozone boundaries in the study area. The light gray lines show major rivers. Black dots are sampling locations for the training data. Stars show the location of towns mentioned in the text.

Study area. Dark black outline indicates the two ecozone boundaries in the study area. The light gray lines show major rivers. Black dots are sampling locations for the training data. Stars show the location of towns mentioned in the text.