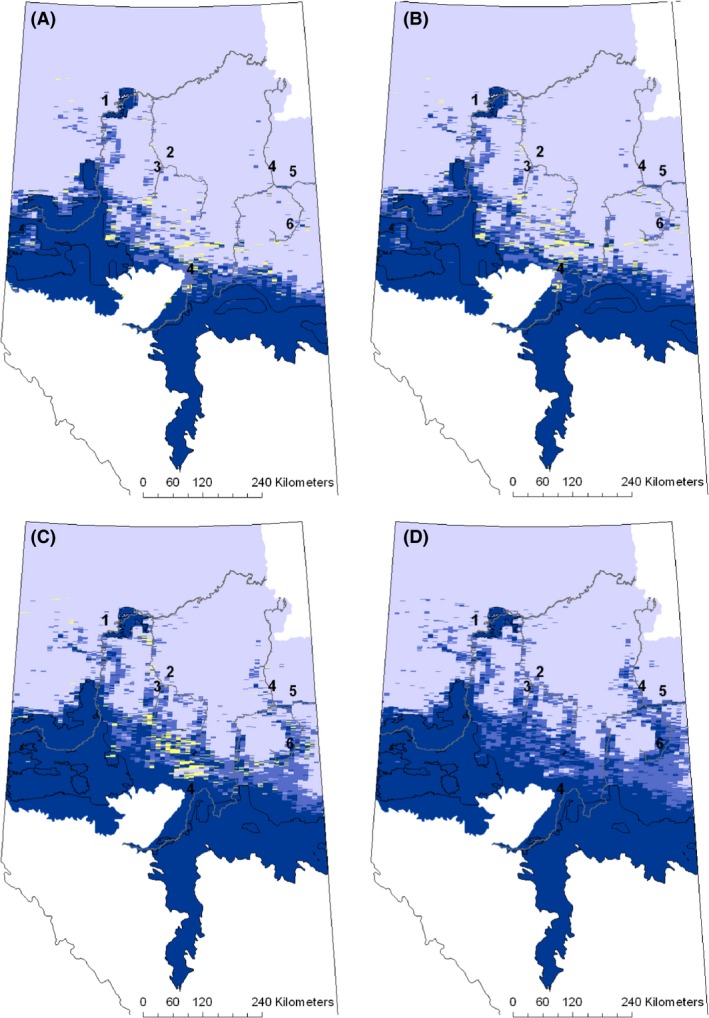
Figure 4.

Predicted distribution of white‐tailed deer for 1970 (A), 1980 (B), 1990 (C), and 2000 (D) decades. Color indicates probability of white‐tailed deer presence is greater than or equal to 0.73 (dark blue), between 0.37 and 0.72 (medium blue), or less than 0.37 (light blue). Yellow indicates where inclusion of undated cut blocks would change the probability of presence from <0.73 to ≥0.73. The numbers correspond to rivers as listed in the caption for Figure 2. The agricultural boundary is outlined in black.
