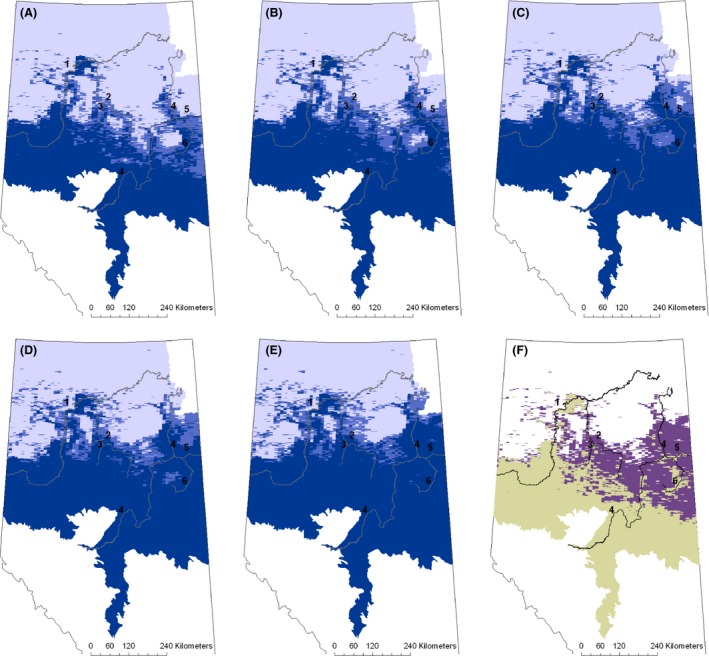
Figure 5.

Predicted decadal distributions for 2010s (A), 2020s (B), 2030s (C), 2040s (D), and 2050s (E). Blue colors designate where predicted probability of white‐tailed deer presence is greater than or equal to 0.73 (dark blue), between 0.37 and 0.72 (medium blue), or less than 0.37 (light blue). The numbers correspond to the Peace (1), Wabasca (2), Loon (3), Athabasca (4), Clearwater (5), and Christina (6) rivers. The difference in area with a predicted probability of presence greater than or equal to 0.73 between 2050 (purple) and 2000 (beige) is shown in (F).
