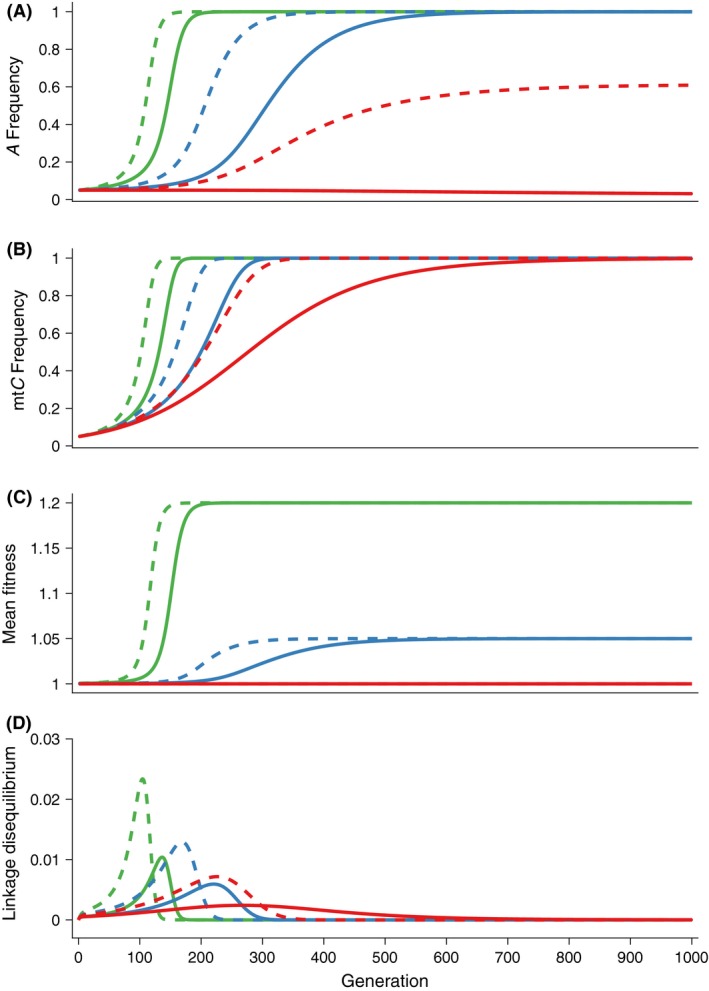
Figure 1.

Comparison of the evolutionary dynamics across three cases: genomic cooperation (green lines), genomic cooperation with sexual antagonism (blue lines), and genomic conflict (red lines). For the genomic cooperation case, α f = α m = 0.1. For the genomic cooperation with sexual antagonism case, α f = 0.1 and α m = −0.05. For the genomic conflict case, α f = 0.1 and α m = −0.1. In all cases, the fitness effect of the mitochondrial C allele is zero (β = 0). (A) Plots of the frequency of the sensitive nuclear allele, PA. (B) Plots of the frequency of the sensitive mitochondrial allele, PC. (C) Plots of the population mean fitness. (D) Plots of the linkage disequilibrium generated between the nuclear and mitochondrial genomes. We contrast simulations without inbreeding (f = 0, solid lines) and with inbreeding (f = 0.5, dashed lines).
