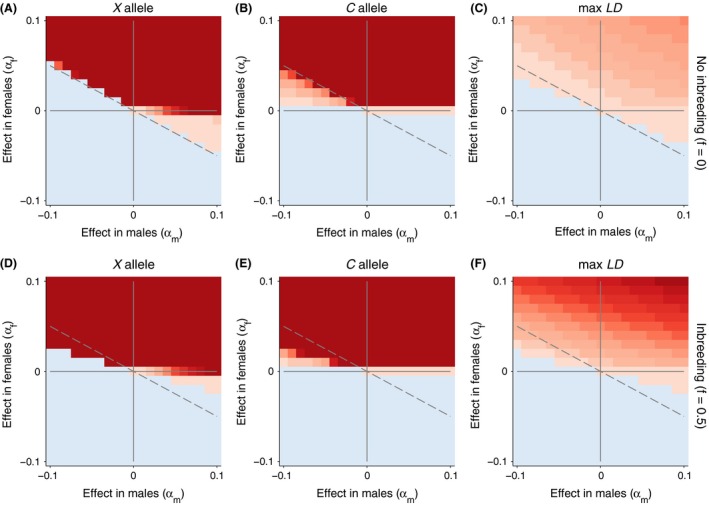
Figure 3.

Evolutionary dynamics of the nuclear and mitochondrial loci with an X‐linked nuclear allele. In all simulations, β is fixed at 0. Allele frequencies that increased after 5000 generations are shown in redder colors. Allele frequencies that decreased are shown in bluer colors. The maximum linkage disequilibrium is plotted on the right with positive values in red and negative values in blue. We contrast cases with and without inbreeding (f = 0, top row) and with inbreeding (f = 0.5, bottom row). The magnitude of the color scale is consistent with and without inbreeding.
