
Figure 3.
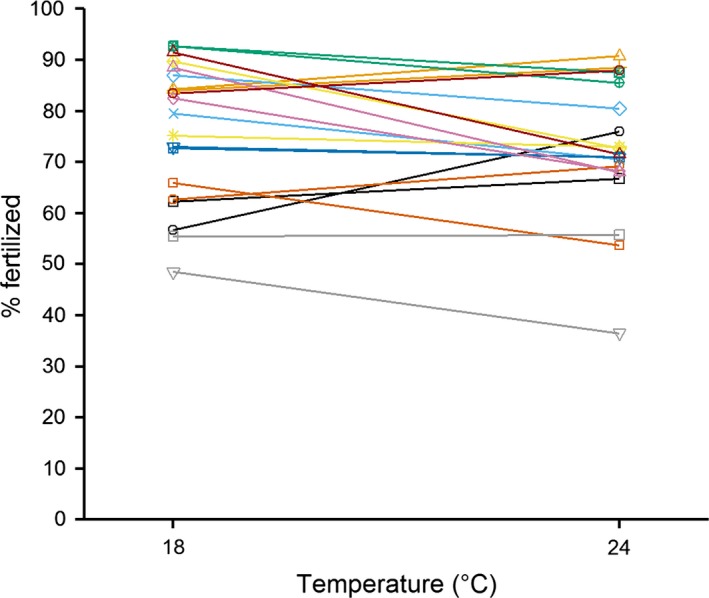
Reaction norm plot showing temperature effect on fertilization rates across individual female mussels (where each line represents a different female; colored by block).
Official websites use .gov
A
.gov website belongs to an official
government organization in the United States.
Secure .gov websites use HTTPS
A lock (
) or https:// means you've safely
connected to the .gov website. Share sensitive
information only on official, secure websites.
Reaction norm plot showing temperature effect on fertilization rates across individual female mussels (where each line represents a different female; colored by block).