Figure 1.

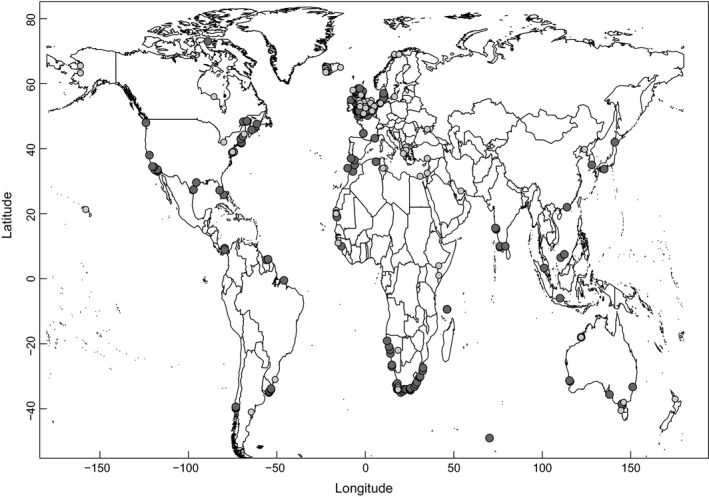
Sampling locations of total intertidal biomass (g AFDM m−2; dark gray circles) and sites where fueling rates were measured (mass gain in g day−1; light gray circles). All data were obtained from the literature (see text for details).

Sampling locations of total intertidal biomass (g AFDM m−2; dark gray circles) and sites where fueling rates were measured (mass gain in g day−1; light gray circles). All data were obtained from the literature (see text for details).