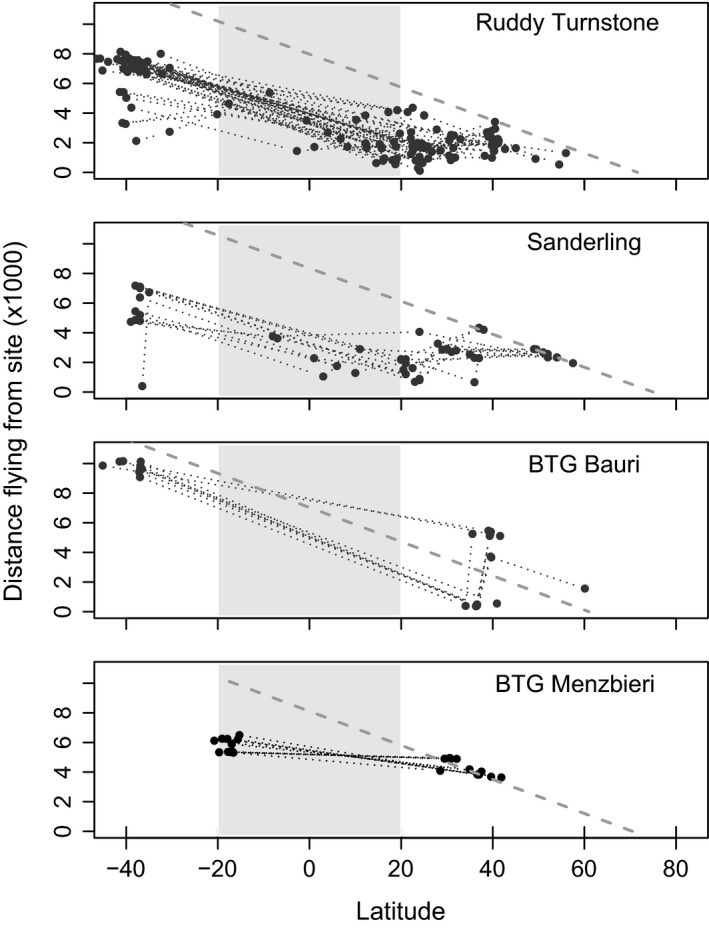
Figure 3.

Flight distances (km) for each leg during northward migration. In each panel, the observed distance covered is plotted against the starting staging site latitude for the species: ruddy turnstone, sanderling, bar‐tailed godwit (BTG) from the subspecies baueri and menzbieri. In each panel, the broken diagonal gray line represents the maximum distance from any staging site to the breeding grounds via a great circle route. Gray‐shaded areas represent low‐latitude regions (i.e., tropical, ranging between −20° and 20° of latitude). The dotted lines connect individual points.
