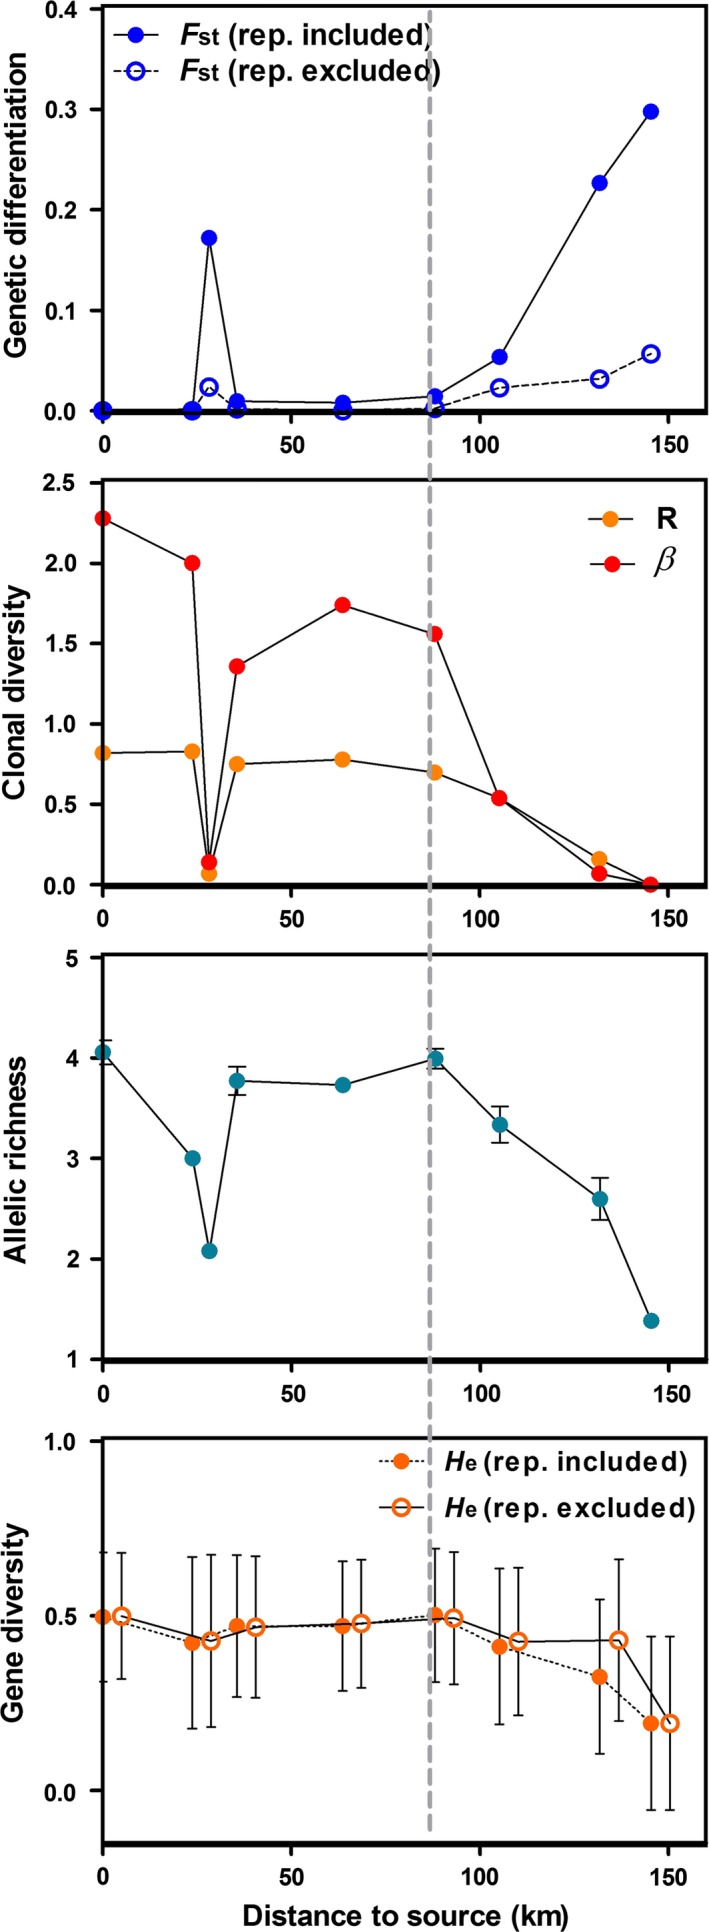
Figure 2.

Variation in genetic indices along the Durance valley. The vertical gray dashed line indicates the so‐called break point. From top down: genetic differentiation to the upstream location (pairwise FST between Prelles and the downstream locations); clonal diversity (clonal richness R and evenness β); mean number of alleles per locus (Â), standardized to the smallest sample size (seven individuals at Saint‐Clément); gene diversity (HE). For FST and HE, calculi were performed including or not clonal replicates (rep. included or rep. excluded, respectively).
