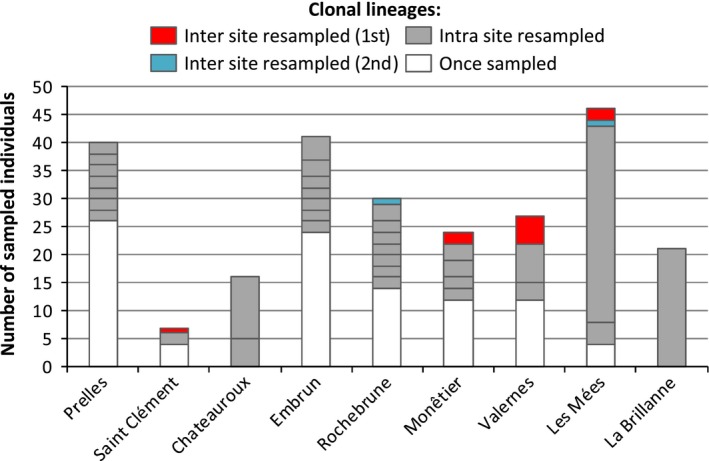
Figure 3.

Details on the clonal composition of the sampled populations. For each location, number of unique clonal lineages, that is, found in a single copy (on the legend: “once sampled,” figured by the white boxes), number of locally abundant clonal lineages, that is, multiple clonal copies found in a single site (on the legend: “intra site resampled,” figured by the gray boxes), and sizes of the two clonal lineages found across locations (on the legend: “inter site resampled 1st and 2nd,” figured by the red and blue boxes).
