
Figure 3.
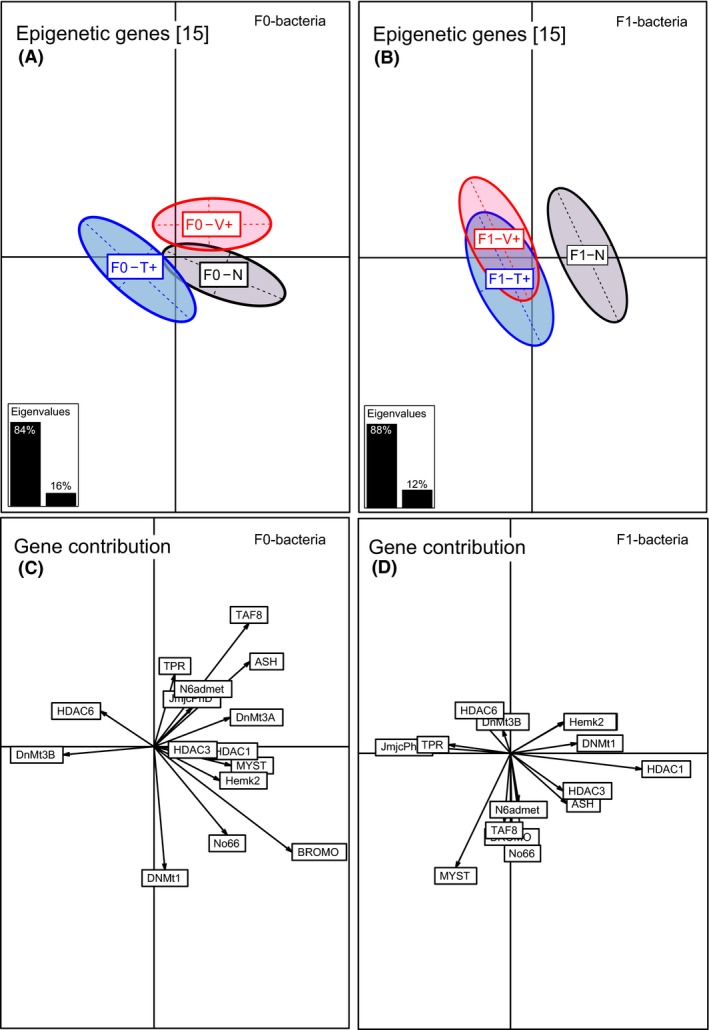
Between component analysis (BCA) based on epigenetic regultation genes of one‐week‐old juveniles (N = 300). Different levels of factors were included in the between component analysis. (A) Factor F0‐bacteria treatment (F0‐Vibrio (F0‐V+) in red, F0‐Tenacibaculum (F0‐T+) in blue, F0‐Naïve (F0‐N) in black); (B) factor F1‐offspring treatment (F1‐Vibrio (F1‐V+) in red, F1‐Tenacibaculum (F1‐T+) in blue, F1‐Naïve (F1‐N) in black). In the underlying scatterplots (C, D), the response variables (epigenetic regultation genes) are symbolized by arrows whereby the direction and the length of the arrows show the quality of the correlation between variables and principle components. The length of the arrow is directional proportional with the contribution of each variable to the total variability. The eigenvalues bar chart is drawn in the left corner, with the two black bars corresponding to the two axes used to draw the BCA plot.