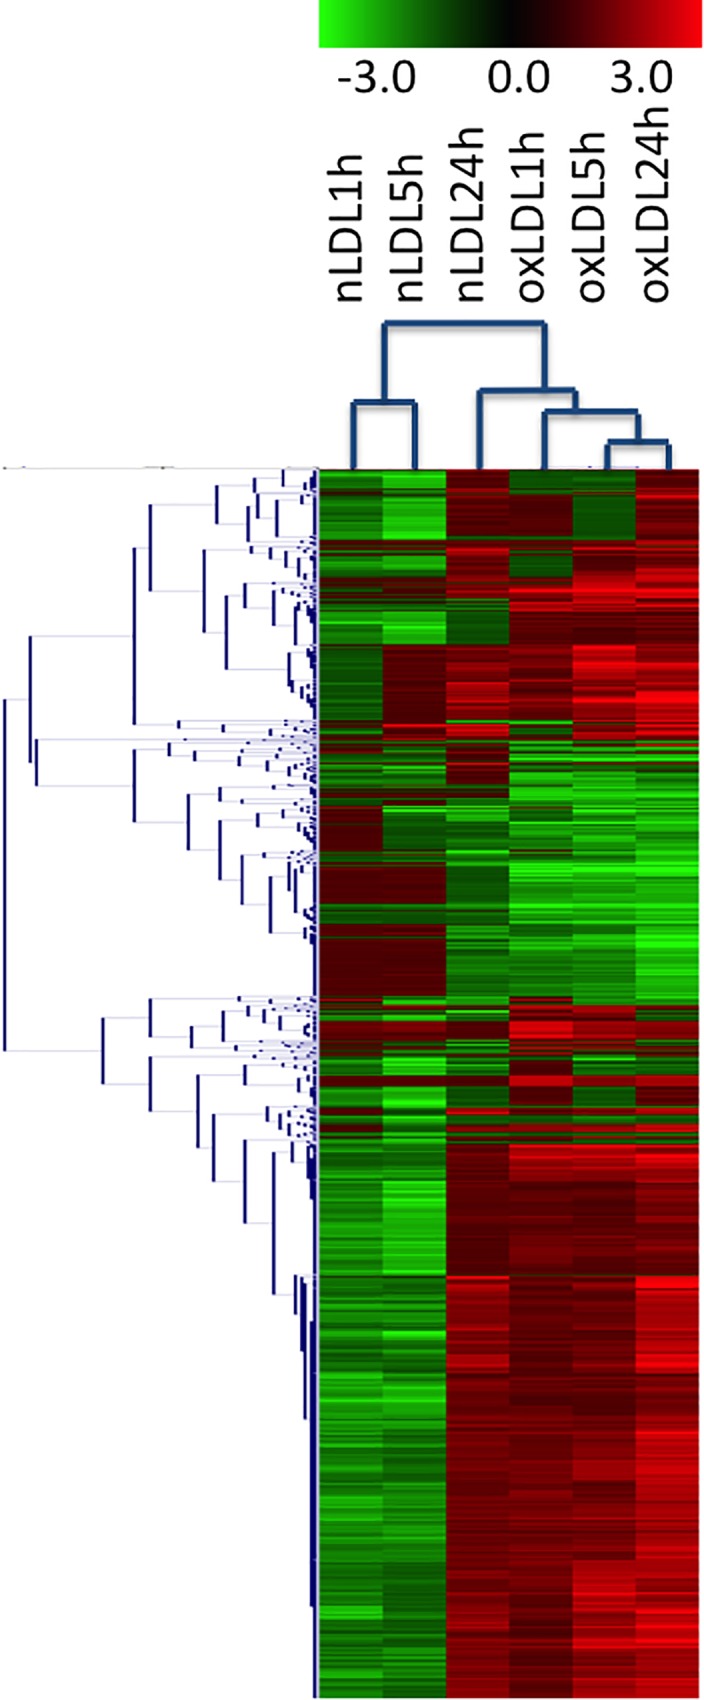
Fig 1. Hierarchical cluster analysis of the differentially expressed genes with more than 2-fold changed expression in one out of six groups (nLDL 1h, nLDL 5h, nLDL 24h, oxLDL 1h, oxLDL 5h and oxLDL 24h) compared to parental hVSMC cells.

The dendrogram on the left indicates correlation between gene expression profiles. The columns in the middle show the normalized expression of each gene in pseudocolor scale (key in the upper).
