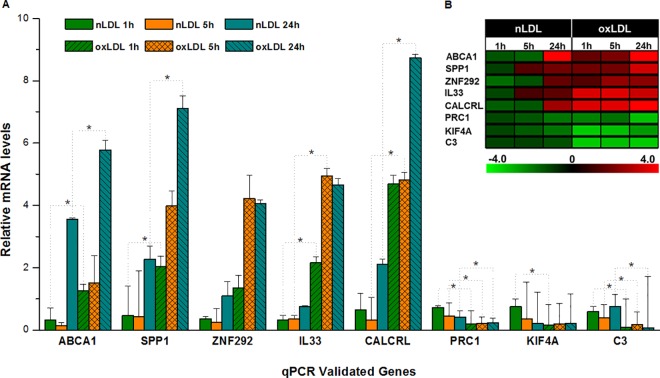
Fig 3.
Validation of microarray results by quantitative RT-PCR (A) Gene expression of ABCA1, SPP1, ZNF292,IL33, CALCRL, PRC1, KIF4A and C3 determined by quantitative real-time RT-PCR. Bars represent means ± SD (n = 3). Relative gene expression levels, normalized to GAPDH expression. Values superscribed by asterisks (*) are significantly different from nLDL and oxLDL groups (B) Heatmap Expression profile (microarray data).

