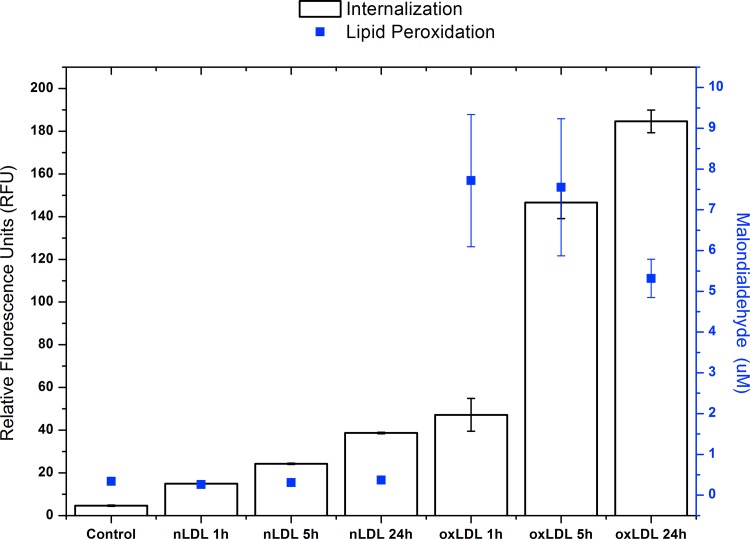
Fig 5. Internalization Assays and lipid peroxidation in VSMC cells.
White boxes corresponding at internalization in VSMC cells of 7.5 μg/mL of nLDLs or oxLDLs DiI label for 0 (Control), 1, 5, and 24 h under medium minimal culture conditions. The magnitude of internalization shown on the left side in the y-axis as relative fluorescence units (RFU) at 530/590 nm (excitation/emission). The blue squares correspond to the level of peroxidation of media supernatant after the same conditions. The lipid peroxidation level is shown in the y-axis on the right side expressed as [μM] of malondialdehyde.

