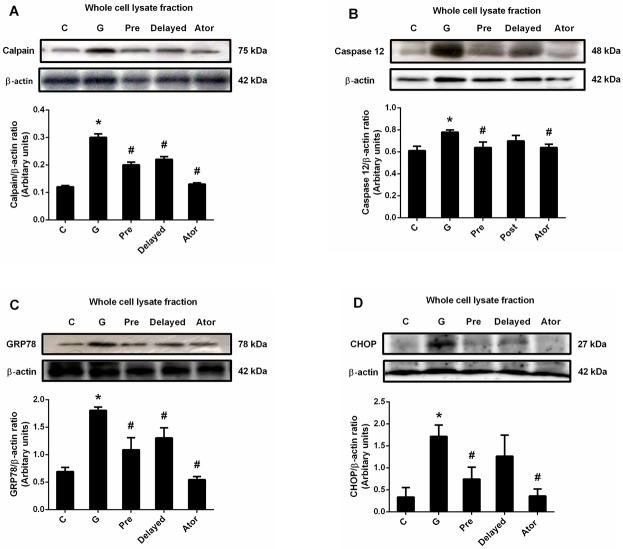
Fig 4. Effects of atorvastatin on the expression of calpain, caspase 12, GRP78 and CHOP.
Immunoblot analysis for calpain (A); caspase 12 (B); GRP78 (C) and CHOP (D) expressions in the whole cell lysate fraction of renal cortical tissues normalized to ß-actin. Bar graph indicates mean ± SEM. (n = 6 rats in each group). *P < 0.05 compared to the control group. #P < 0.05 compared to the gentamicin-treated group. C: control group; G: gentamicin-treated group; Pre: atorvastatin pretreatment group; Delayed: delayed treatment group and Ator: atorvastatin group.

