
Figure 9.
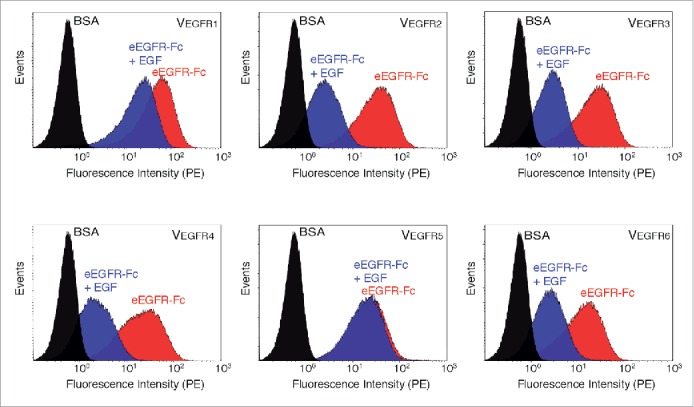
Competition of EGF and the selected Nbs for binding to eEGFR-Fc determined by flow cytometry analysis of E. coli bacteria. Flow cytometry analysis of induced E. coli EcM1 bacteria displaying the indicated Nb (VEGFR1-6) and incubated with 50 nM of biotinylated BSA (black) or eEGFR-Fc in the absence (red) or presence (blue) of 25 µM EGF. Overlay of histograms showing the fluorescence intensity of bacteria after staining with secondary Streptavidin-PE.