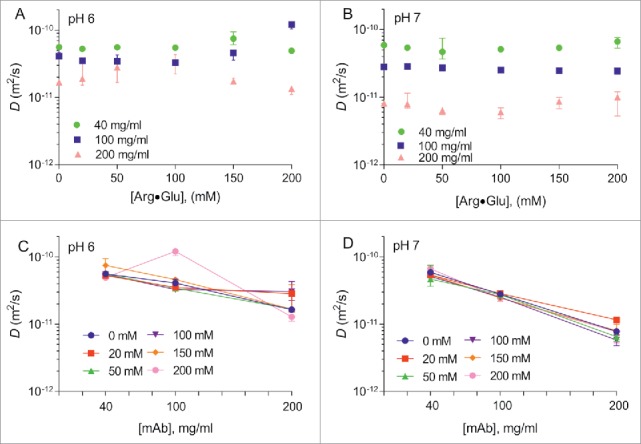
Figure 4.

Translational diffusion coefficients D of mAb2 measured by DOSY. The values of D for mAb2 formulated at pH 6 (A) and pH 7 (B) are shown vs the concentration of Arg·Glu added. The same data is also presented in different coordinates on panels (C) and (D), respectively. (Color version of this figure is available online)
