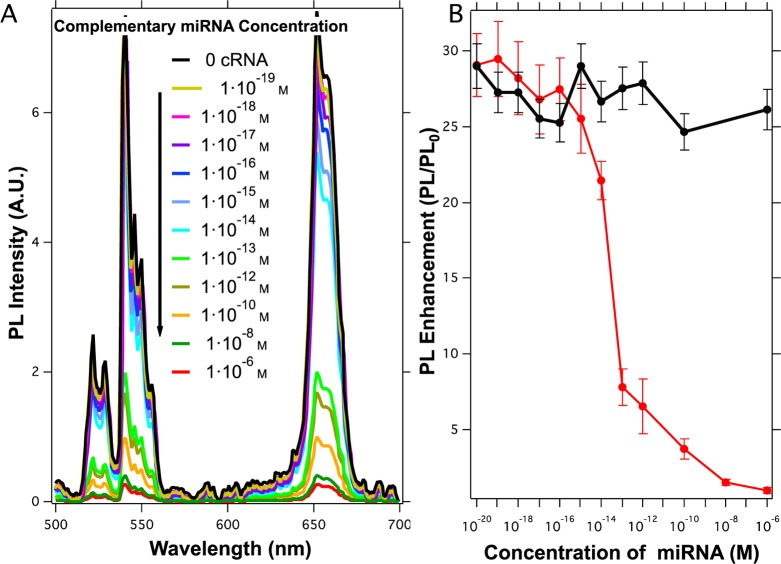
Figure 6.
(A) Representation of the upconversion emission spectra of 0.04 mg/mL ssDNA-UCNP@SiO2 nanoparticles with 0.1 mg/mL GQDs after incubation with different concentrations of complementary miRNA sequences. The black line represents upconversion enhancement in the absence of complementary miRNA. (B) Representations of PL enhancement as a function of the complementary miRNA concentration (red) and PL enhancement in the presence of noncomplementary miRNA sequences (black). Each point is the result of five independent experiments.

