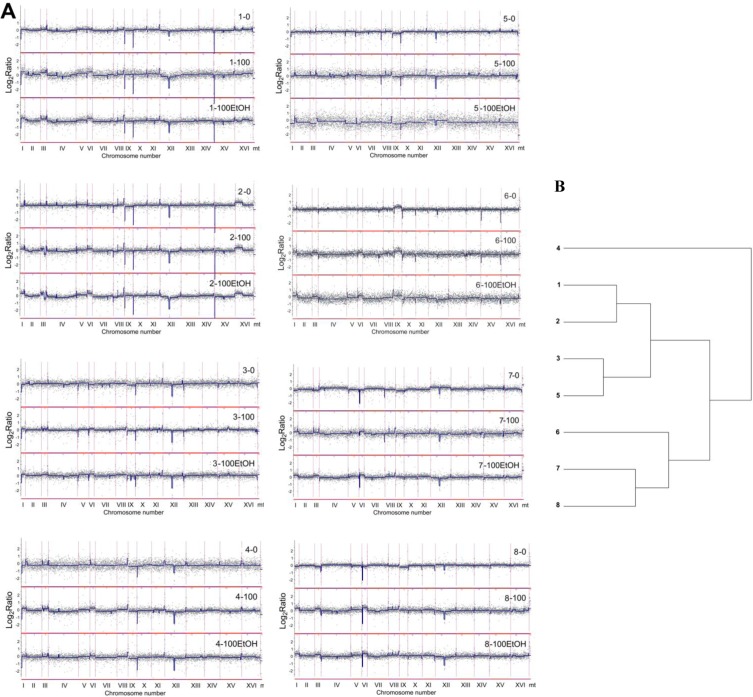
Figure 4. Analysis of the variability in the gene copy number of wine strains (1 to 8) using array-CGH.
A. Array-CGH profiles are shown. Each grey dot represents the value of the log2 ratio for an individual gene. Blue lines were provided to emphasize the most accented differences (DNA losses and gains). 0, control conditions; 100, 100 generations; 100EtOH, 100 generations in the presence of 5% EtOH. B. The relatedness of strains analyzed using cluster analysis. Similarity tree is shown.

