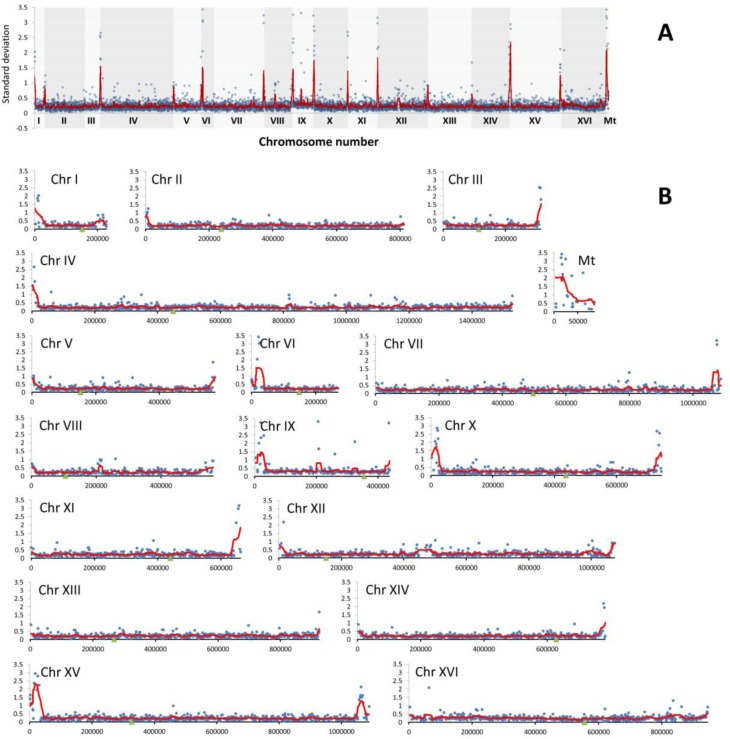
Figure 5. The divergence of relative abundance of genes as determined by array-CGH represented by standard deviation (SD) of log2 ratio values for each gene in wine strains.
A. The summary plot for the whole genome. B. Individual plots for each chromosome. Blue dots indicate the SD values for individual genes, the red line denotes the smoother trend calculated by moving average of SD values to expose the genome regions of higher log2 ratio divergence and green triangles indicate centromere position.

