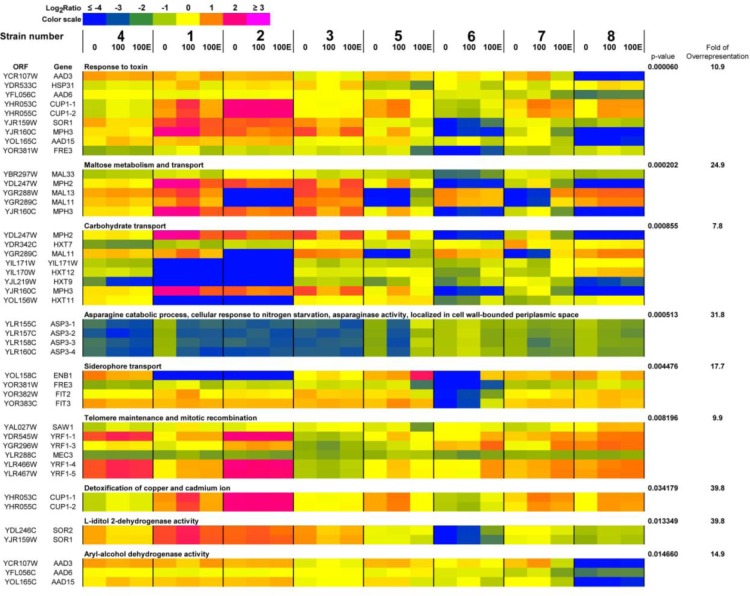
Figure 7. A heat map generated from array-CGH data.
Functional categories overrepresented in the group of genes that were the most divergent among analyzed strains are shown. The strains were ordered according to the result of clustering analysis (Figure 4B) and the selected genes were grouped according to their functional assignment. Positive and negative log2 ratio values represent higher and lower than average abundance of the gene, as determined by array-CGH analysis. 0, control conditions; 100, 100 generations; 100E, 100 generations in the presence of 5% EtOH.

