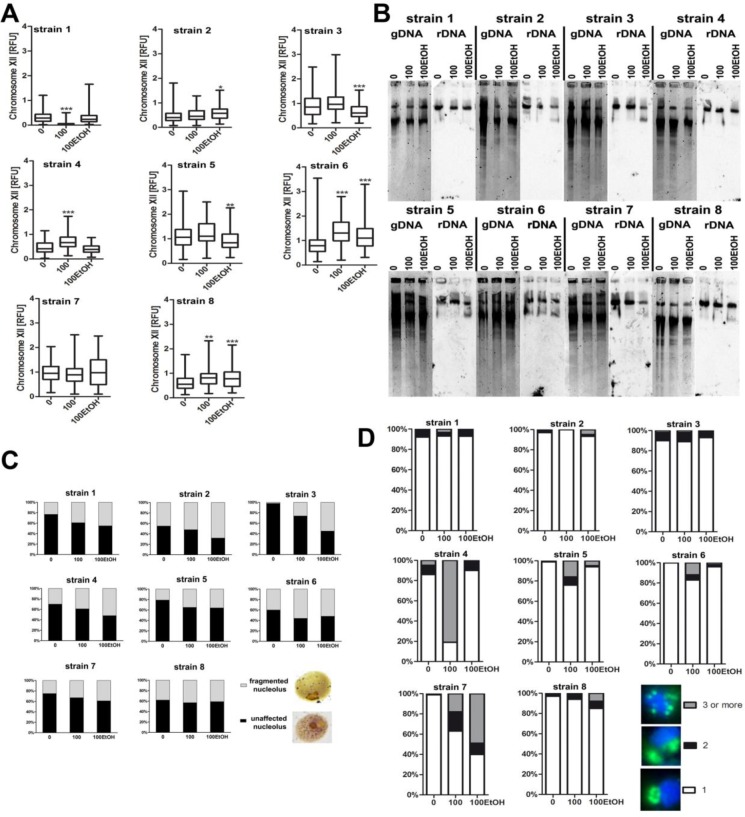
Figure 9. Generation- and ethanol-mediated changes in rDNA and nucleolus state.
A. Analysis of rDNA content. rDNA was visualized using WCPP specific to chromosome XII that contains rDNA locus in yeast. Fluorescence signals of chromosome XII were quantified using ImageJ software. The integrated fluorescence density is presented in relative fluorescence units (RFUs). 0, control conditions; 100, 100 generations; 100EtOH, 100 generations in the presence of 5% EtOH. Box and whisker plots are shown, n = 100. ***p < 0.001, **p < 0.01, *p < 0.05 compared to the standard growth conditions (ANOVA and Dunnett's a posteriori test). B. Southern blot analysis of the rDNA length. gDNA, genomic DNA after digestion. C. Silver staining of nucleolar organizer region-based analysis of nucleolus fragmentation. Fragmented nucleoli were scored [%]. The typical micrographs are shown (right). D. Analysis of chromosome XII signals using fluorescence in situ hybridization and whole chromosome painting probe (WCPP). Chromosome XII-specific signals were scored in 100 nuclei and presented as a percentage, namely three signal categories were considered: 1, 2 and 3 and more signals, n = 100. The typical micrographs are shown (right). The cells were labeled with FITC to detect chromosome XII-specific signals (green). DNA was visualized using DAPI staining (blue).

