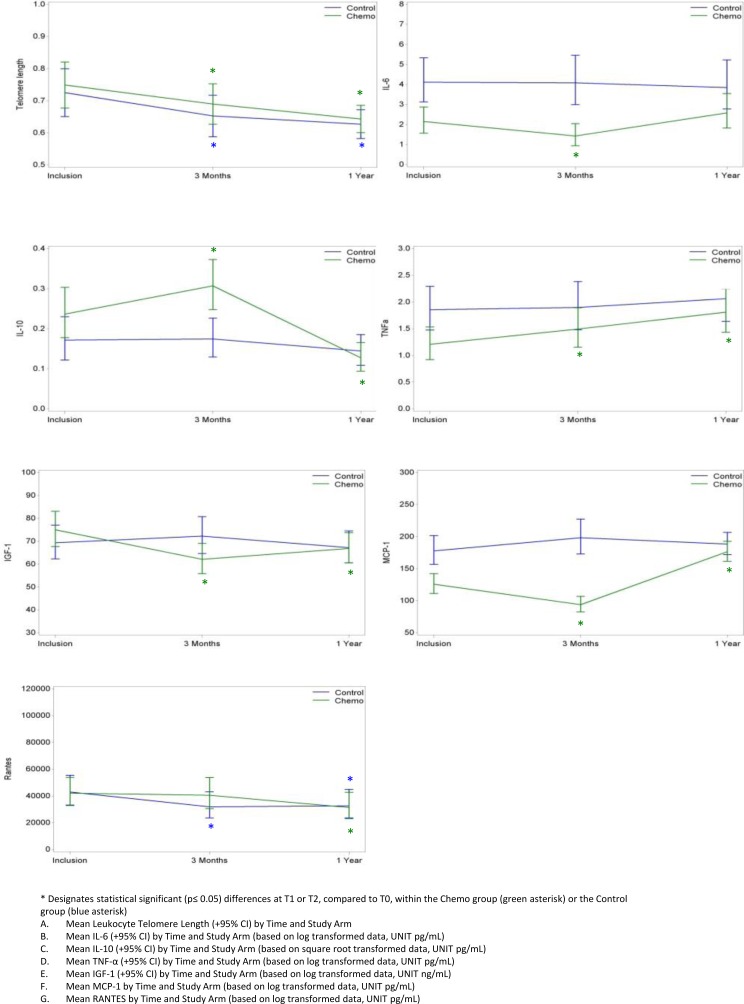
Figure 1. Evolution over time of aging biomarker results in the Chemo and Control Groups.
* Designates statistical significant (p≤ 0.05) differences at T1 or T2, compared to T0, within the Chemo group (green asterisk) or the Control group (blue asterisk) A. Mean Leukocyte Telomere Length (+95% CI) by Time and Study Arm B. Mean IL-6 (+95% CI) by Time and Study Arm (based on log transformed data, UNIT pg/mL) C. Mean IL-10 (+95% CI) by Time and Study Arm (based on square root transformed data, UNIT pg/mL) D. Mean TNF-α (+95% CI) by Time and Study Arm (based on log transformed data, UNIT pg/mL) E. Mean IGF-1 (+95% CI) by Time and Study Arm (based on log transformed data, UNIT ng/mL) F. Mean MCP-1 by Time and Study Arm (based on log transformed data, UNIT pg/mL) G. Mean RANTES by Time and Study Arm (based on log transformed data, UNIT pg/mL).

