
Figure 2. PrP (106-126) treatment induced neuronal cytotoxicity.
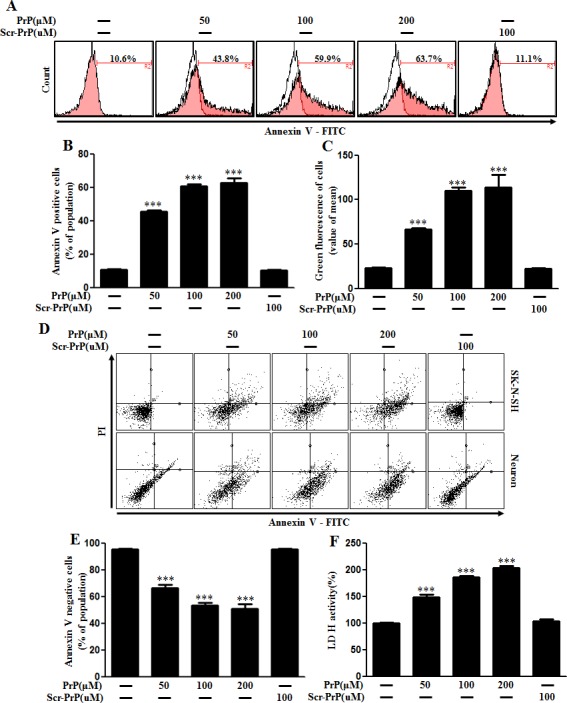
A. Primary neuronal cells were treated with PrP (106-126) in a dose-dependent manner for 24h. Cell viability was measured by annexin V assay. Cells were treated with FITC-annexin V, which binds to phosphatidylserine to the plasma membrane during apoptosis. B. Bar graph indicating the average number of annexin V positive cells. C. Bar graph displaying the mean value of green fluorescence of total cells. D. Primary neuronal cells and SK-N-SH neuroblastoma cells were treated with PrP (106-126) in a dose-dependent manner for 24h. Cell viability was measured by annexin V assay. Cells were treated with FITC-annexin V and PI, which binds to phosphatidylserine to the plasma membrane and nuclei during apoptosis. E. Bar graph indicating the average number of annexin V negative cells. F. Lactate dehydrogenase (LDH) assay was used to quantify LDH released into the medium. *** p < 0.001; significant differences between each treatment group. PrP, Prion peptide (106-126); sc-PrP, scrambled Prion peptide.