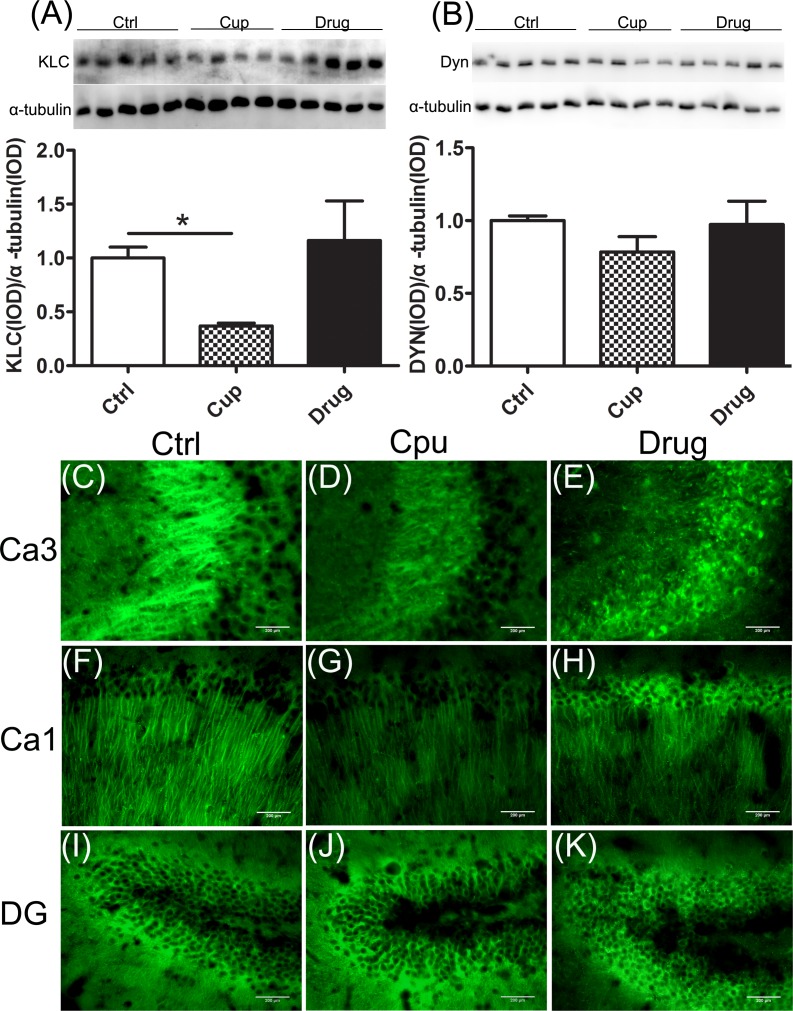
Figure 3. Reduction of proteins essential for axonal transport in the hippocampus.
A. KLC expression in the hippocampus was compared among the three groups. B. Dyn expression in the hippocampus was compared among the three groups. Figures C.-K. were displayed the immunofluorescence staining of KLC in subregions of the hippocampus, including Ca3 (C-E), Ca1 (F-H) and DG (I-K).*denotes statistical significance compared with controls (P < 0.05). Images were captured from stained frozen sections using a fluorescence microscope equipped with 40×objectives. Scale bar, 200μm.

