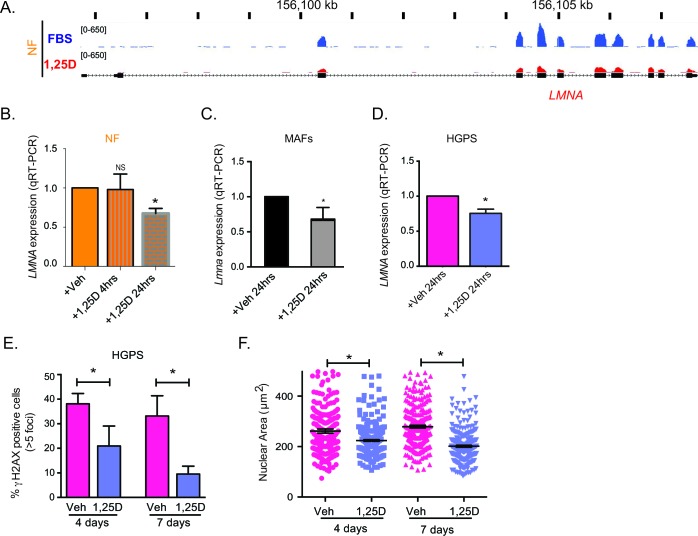
Figure 4. Regulation of LMNA gene expression by vitamin D/VDR.
A. RNAseq analysis performed in NF after a 24-h treatment with 1,25D (10−7M) or vehicle (FBS) as control. Map shows the levels of transcripts containing exon sequences of the LMNA gene in control cells (blue) and 1,25D-treated cells (red). B. Relative expression of total transcripts from LMNA gene by qRT-PCR in NF treated with 1,25D for 4 h or 24 h. Results are the mean±sem of 3 biological repeats. C. Relative expression of LMNA transcripts by qRT-PCR in MAFs treated with 1,25D for 24 h. D. Relative expression of total transcripts from LMNA gene as determined by qRT-PCR in HGPS patient-derived treated with 1,25D for 24 h or vehicle control. E. IF for γH2AX in HGPS cells treated with 1,25D or vehicle for 4 and 7 days. Graph shows percentage of γH2AX-positive cells. A total of 400 cells were quantitated per condition. F. DAPI staining and IF with lamin A antibody in HGPS cells treated with 1,25D or vehicle for 4 and 7 days. The nuclear volume was calculated using Leica's microscope software. A total of 300 cells were quantitated. All graphs represent mean±sem. *p value of statistical significance (*p ≤ 0.05).

