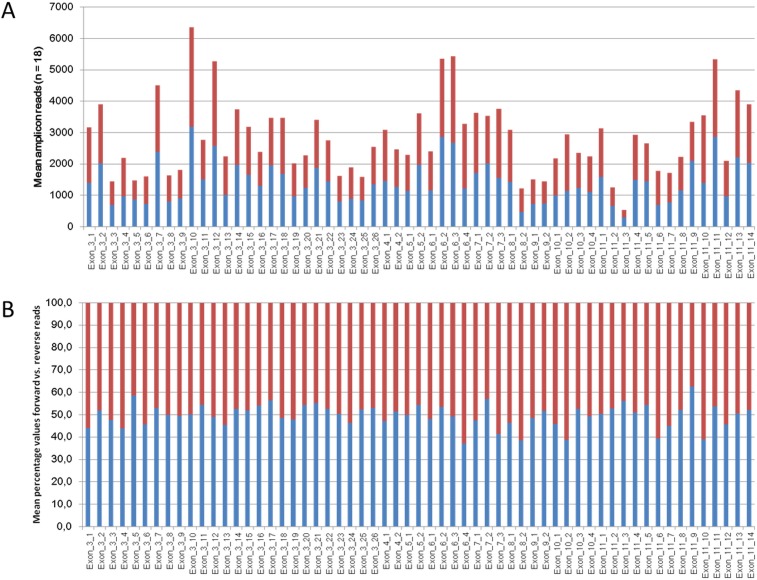
Figure 1.
A. Mean amplicon coverage of the 59 amplicons of TET2. Shown are the coverage of the forward reads in blue bars and the coverage of the reverse reads in red bars. Values of 18 samples from 5 independent analyses were averaged. B. Percentages of the distribution from forward and reverse reads of the 59 amplicons of TET2. Values of 18 samples from 5 independent runs were averaged.

