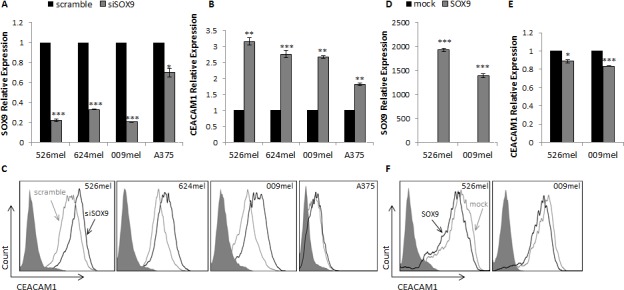
Figure 1. SOX9 influences CEACAM1 expression in melanoma cells.

A.-C. 526mel, 624mel, 009mel and A375 cells were transfected with an anti-SOX9 siRNA or a scrambled control. 72 hours post-transfection, SOX9 A. and CEACAM1 B. mRNA levels were assessed by qPCR and normalized to GAPDH. CEACAM1 protein levels were evaluated by flow Cytometry C. D.-F. 526mel and 009mel cells were transfected with a SOX9 construct or an empty vector (mock). 72 hours post-transfection, SOX9 D. and CEACAM1 E. mRNA levels were assessed by qPCR and normalized to GAPDH. CEACAM1 protein levels were evaluated by flow cytometry F.. Figures show a representative experiment out of several performed. Asterisks represent P values: *P < 0.05; **P < 0.01; ***P < 0.001 (2-tailed t test).
