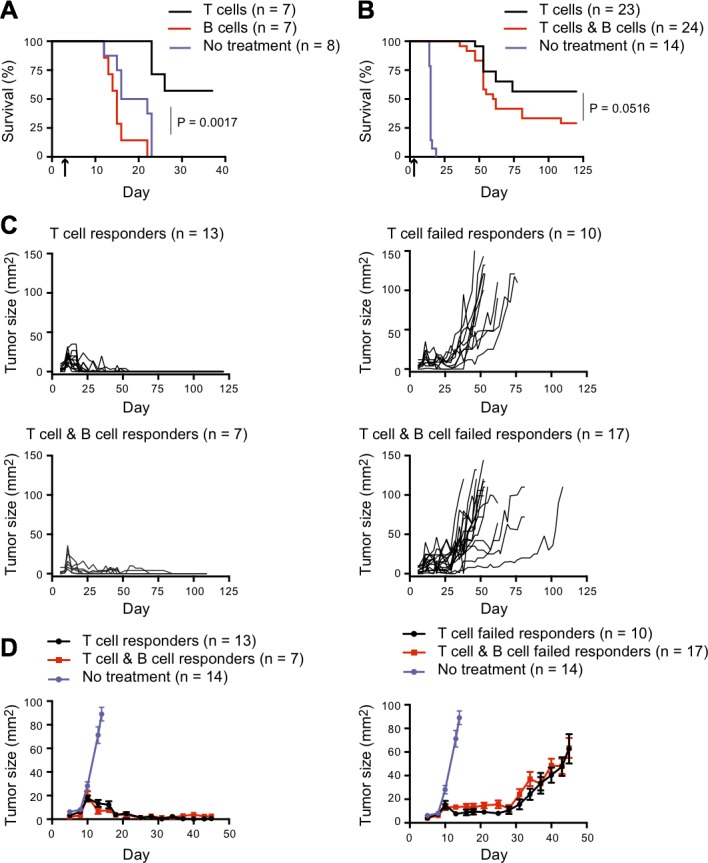
Figure 1. Effect of B cell co-transfer on CD4+ T cell-dependent tumor control.

A. Rag2−/− mice were injected s.c. in the flank with 0.5×10⁶ B16.mHELMCC tumor cells and adoptively transferred with 0.2×10⁶ naive 5C.C7 T cells or 1×10⁶ naive SWHEL B cells 5 days later (indicated by arrow on graph x-axis). Mice were euthanized when tumors reached 100mm2. Kaplan-Meier survival analysis of the three groups; black line: 5C.C7 T cells (n = 7), red line: SWHEL B cells (n = 7) and purple line: no treatment (n = 8). P = 0.0017 for comparison between no treatment and T cell groups, while difference between no treatment and B cell groups was not significant as calculated using Log-rank test with Gehan-Breslow-Wilcoxon post-test. (B-D) Rag2−/− mice were injected s.c. in the flank with 0.5×10⁶ B16.mHELMCC tumor cells and 3 days later adoptively transferred with 0.2×10⁶ naive 5C.C7 T cells or a combination of 0.2×10⁶ naive 5C.C7 T cells and naïve 1×10⁶ SWHEL B cells (indicated by arrow on graph x-axis). Data are representative of two independent experiments. Mice were euthanized when tumors reached 100mm2, with Kaplan-Meier survival analysis shown in B. Black line: 5C.C7 T cells (n = 23), red line: 5C.C7 T cells plus SWHEL B cells (n = 24), purple line: no treatment (n = 14). P = 0.0516 for comparison between T cell and B cell groups, by Log-rank test with Gehan-Breslow-Wilcoxon post-test. C. Individual tumor growth curves separated on the basis of tumor control into long-term responders (tumor-free at 120 days) and failed responders. Top left: 5C.C7 T cell group, responders (n = 13). Top right: 5C.C7 T cell group, failed responders (n = 10). Bottom left: 5C.C7 T cells plus SWHEL B cell group, responders (n = 7). Bottom right: 5C.C7 T cells plus SWHEL B cell group, failed responders (n = 17). D. Tumor growth (mean±SEM) of responders (left) and failed responders (right) overlaid with control group that received no treatment (purple dot). Note the change in scale, to highlight the early effects on tumor growth.
