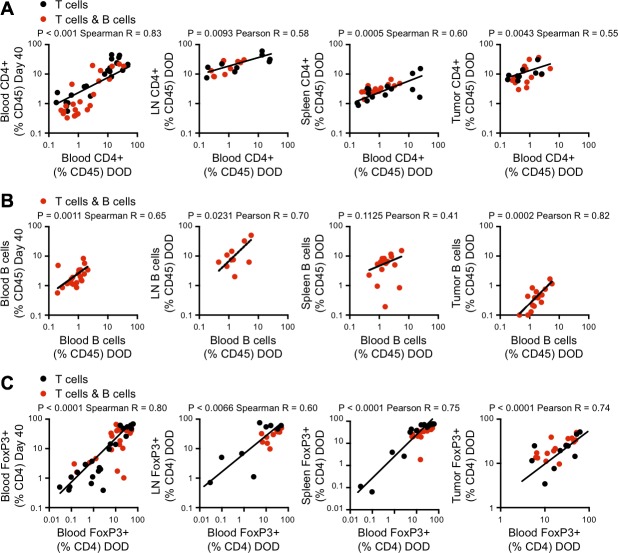
Figure 3. Analysis of immune cell populations in blood, lymph nodes, spleen and tumor.
In the experiment described in Figure 1B, flow cytometric analysis of blood, lymph nodes, spleen and tumor was performed at the time of euthanasia (when tumors reached 100mm2). A. Correlation between CD4+ T cell frequency in the blood on the day of death (DOD) and on day 40 (as shown in Figure 2) (left panel) and CD4+ T cell frequencies in blood and lymph node, spleen and tumor on DOD (right panels). Black dots: 5C.C7 CD4+ T cell group. Red dots: 5C.C7 CD4+ T cell plus SWHEL B cell group. Log-transformed data. B. Correlation between B cell frequency in the blood on DOD and d40 (left panel) and between blood and lymph node, spleen and tumor on DOD (right panels). C. Correlation between Foxp3+ iTreg frequency as a percent of CD4+ T cells in the blood on DOD and d40 (left panel) and FoxP3+ (%CD4+) in blood and lymph node, spleen and tumor on the DOD (right panels). Black dots: 5C.C7 CD4+ T cell group. Red dots: 5C.C7 CD4+ T cell plus SWHEL B cell group. For each analysis, data from both groups was pooled, and a D'Agostino-Pearson omnibus normality test was performed prior to correlation analysis to determine the appropriate parametric or non-parametric test. Parametric Pearson correlation coefficients or nonparametric Spearman correlations were used as indicated on each panel.

