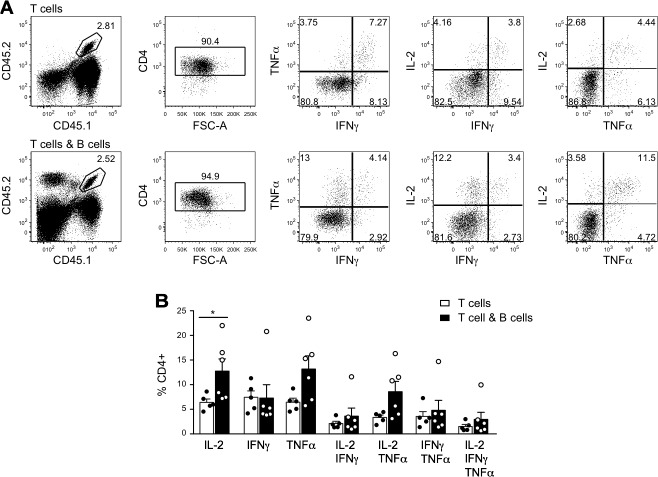
Figure 4. Cytokine production by CD4+ T cells in tumor-bearing mice.
In the experiment described in Figure 1B, 6 mice that received T and B cells and 5 mice that received T cells alone were euthanized as tumors reached critical size on day 52 post tumor cell inoculation. Splenocytes were cultured overnight with MCC peptide and analyzed by flow cytometry for intracellular cytokine production. A. Representative dot plots for mice that received 5C.C7 CD4+ T cells alone (top panels) or 5C.C7 CD4+ T cells plus SWHEL+ B cells (bottom panels). T cells were gated as CD45.1+CD45.2+CD4+ and analyzed for IL-2, TNFα and IFNγ expression. Frequency of gated events is shown. B. Frequency of cytokine producing cells within CD4+ T cells. Individual measurements (dots) and mean±SEM of each group are shown. * = p < 0.05 by unpaired Student's t test.

