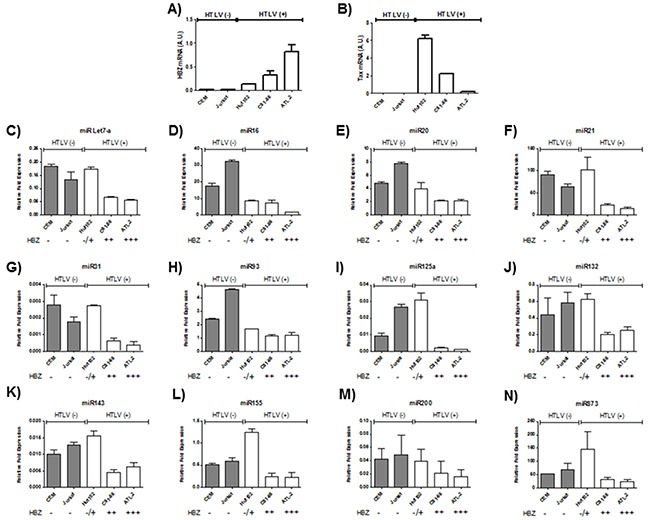
Figure 1. Decreased miRNA levels in HTLV-1 infected cells lines.

A-B. Relative expression of tax and hbz was measured by quantitative RT-PCR and normalized to HPRT RNA levels in the two controls T-cell lines CEM and Jurkat (grey bars) and the three HTLV-1 infected T-cells lines Hut-102, C81-66 and ATL-2 (white bars). C-N. The levels of the indicated miRNAs were measured using qRT-PCR and normalized to U6 snRNA levels in the two controls T-cell lines CEM and Jurkat (grey bars) and the three HTLV-1 infected T-cells lines Hut-102, C81-66 and ATL-2 (white bars). Data are the means ± S.D. from three independent experiments.
