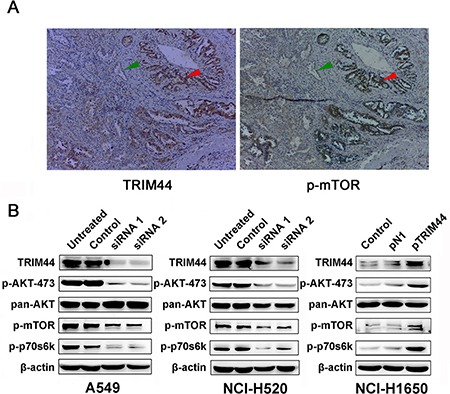
Figure 5. Association between TRIM44 overexpression and mTOR activity.

(A) Immunohistochemical analysis of TRIM44 and p-mTOR expression in primary tumor tissues from patient 1181. Red arrows show cells with high expression of TRIM44 and high mTOR activity, whereas the green arrows show cells with low TRIM44 expression and low mTOR activity. (B) Western blot analysis of TRIM44, mTOR signaling pathway components and downstream effectors in NSCLC cells.
